
Working with spatial data is surprisingly hard. Questions like "show me houses walking distance from a coffeeshop" require deep specialization in GIS (geographic information systems), making answers inaccessible to the majority of people with these questions.
This complexity makes doing useful geospatial analysis prohibitively expensive or frustrating. At Bunting, we're making it easy to work with spatial data, and today are announcing our first product launch: an IDE for spatial data.
Despite the abundance of open spatial data like OpenStreetMap, GIS technology has stagnated. Geospatial engineers still manually choose coordinate systems, translate queries into complex spatial joins, and write their own visualization stack just to answer simple questions.
The current GIS tech stack
To find all houses walking distance from a coffeeshop, a GIS developer must first download houses (blue) and coffeeshops (red) from OpenStreetMap via the Overpass API with the Overpass wizard:
OpenStreetMap has poorly tagged houses in Chicago — for most real estate applications, parcel data is downloaded from the county assessor.
Then we'll create a new PostGIS database, an extension of PostgreSQL,
and load the .geojson files using ogr2ogr, which requires installing GDAL.
With our data loaded, we have polygons and points enriched with the features from OpenStreetMap.
     name      |                     geom
---------------+----------------------------------------------
 Atomix        | POINT(-87.6768082 41.8957846)
 Baba’s Coffee | POINT(-87.7090007 41.9826086)
 Bakin’ & Eggs | POINT(-87.6672322 41.9382915)
 Bel-Ami       | POINT(-87.6936192 41.9819240)
 Bitoys Bistro | POINT(-87.7742015 41.8948793)
(5 rows)
Because geospatial coordinates are in degrees, not feet or meters, we'll approximate walking distance (1 mi) as 0.015°. If we wanted precision, this gets more difficult: the Earth is spherical, but distance and area is best calculated in a Cartesian coordinate plane. Normally GIS professionals choose a projected coordinate system (EPSG:3435 for Chicago) and project coordinates onto the Cartesian coordinate plane.
Finally, we'll write a spatial query to relate coffeeshop locations with house locations, using special SQL functions built into PostGIS that allow for nearest neighbor queries.
SELECT "addr:street", coffeeshops.name, coffeeshops.dist
FROM houses_geojson_191 houses
CROSS JOIN LATERAL (
  SELECT coffeeshops.name,
    coffeeshops.geometry <-> houses.geometry AS dist
  FROM coffeeshops_geojson_44 AS coffeeshops
  ORDER BY dist
  LIMIT 1
) coffeeshops
WHERE coffeeshops.dist < 0.015;
But because we're in psql, the output is textual, and not mapped. Unless we
swap to GIS browsers like QGIS, we'll need to convert the data to GeoJSON and load
it into an online map, assuming we don't build this ourselves.
SELECT
  json_build_object(
    'type', 'FeatureCollection',
    'features', json_agg(ST_AsGeoJSON(t.*)::json)
  )
FROM (
  SELECT "addr:street", coffeeshops.name, coffeeshops.dist, houses.geometry
  FROM houses_geojson_191 houses
  CROSS JOIN LATERAL (
    SELECT coffeeshops.name,
      coffeeshops.geometry <-> houses.geometry AS dist
    FROM coffeeshops_geojson_44 AS coffeeshops
    ORDER BY dist
    LIMIT 1
  ) coffeeshops
  WHERE coffeeshops.dist < 0.015
) AS t;
We're finally gifted with a GeoJSON that we can open in a tool like geojson.io.
The complexity of these steps gives geospatial an unnecessarily steep learning curve. We're building an IDE for geospatial data to make this easier.
What's a spatial IDE?
Just like the modern IDE connects code, documentation, and production build systems, a spatial IDE connects data, spatial manipulations, and geographic visualizations. We're building this for the thousands of developers that wrangle geospatial data pipelines, SRIDs, tile servers, and shapely operations.
To show what's possible, I uploaded the coffeeshop and house data to our GeoJSON importer and loaded up the IDE.
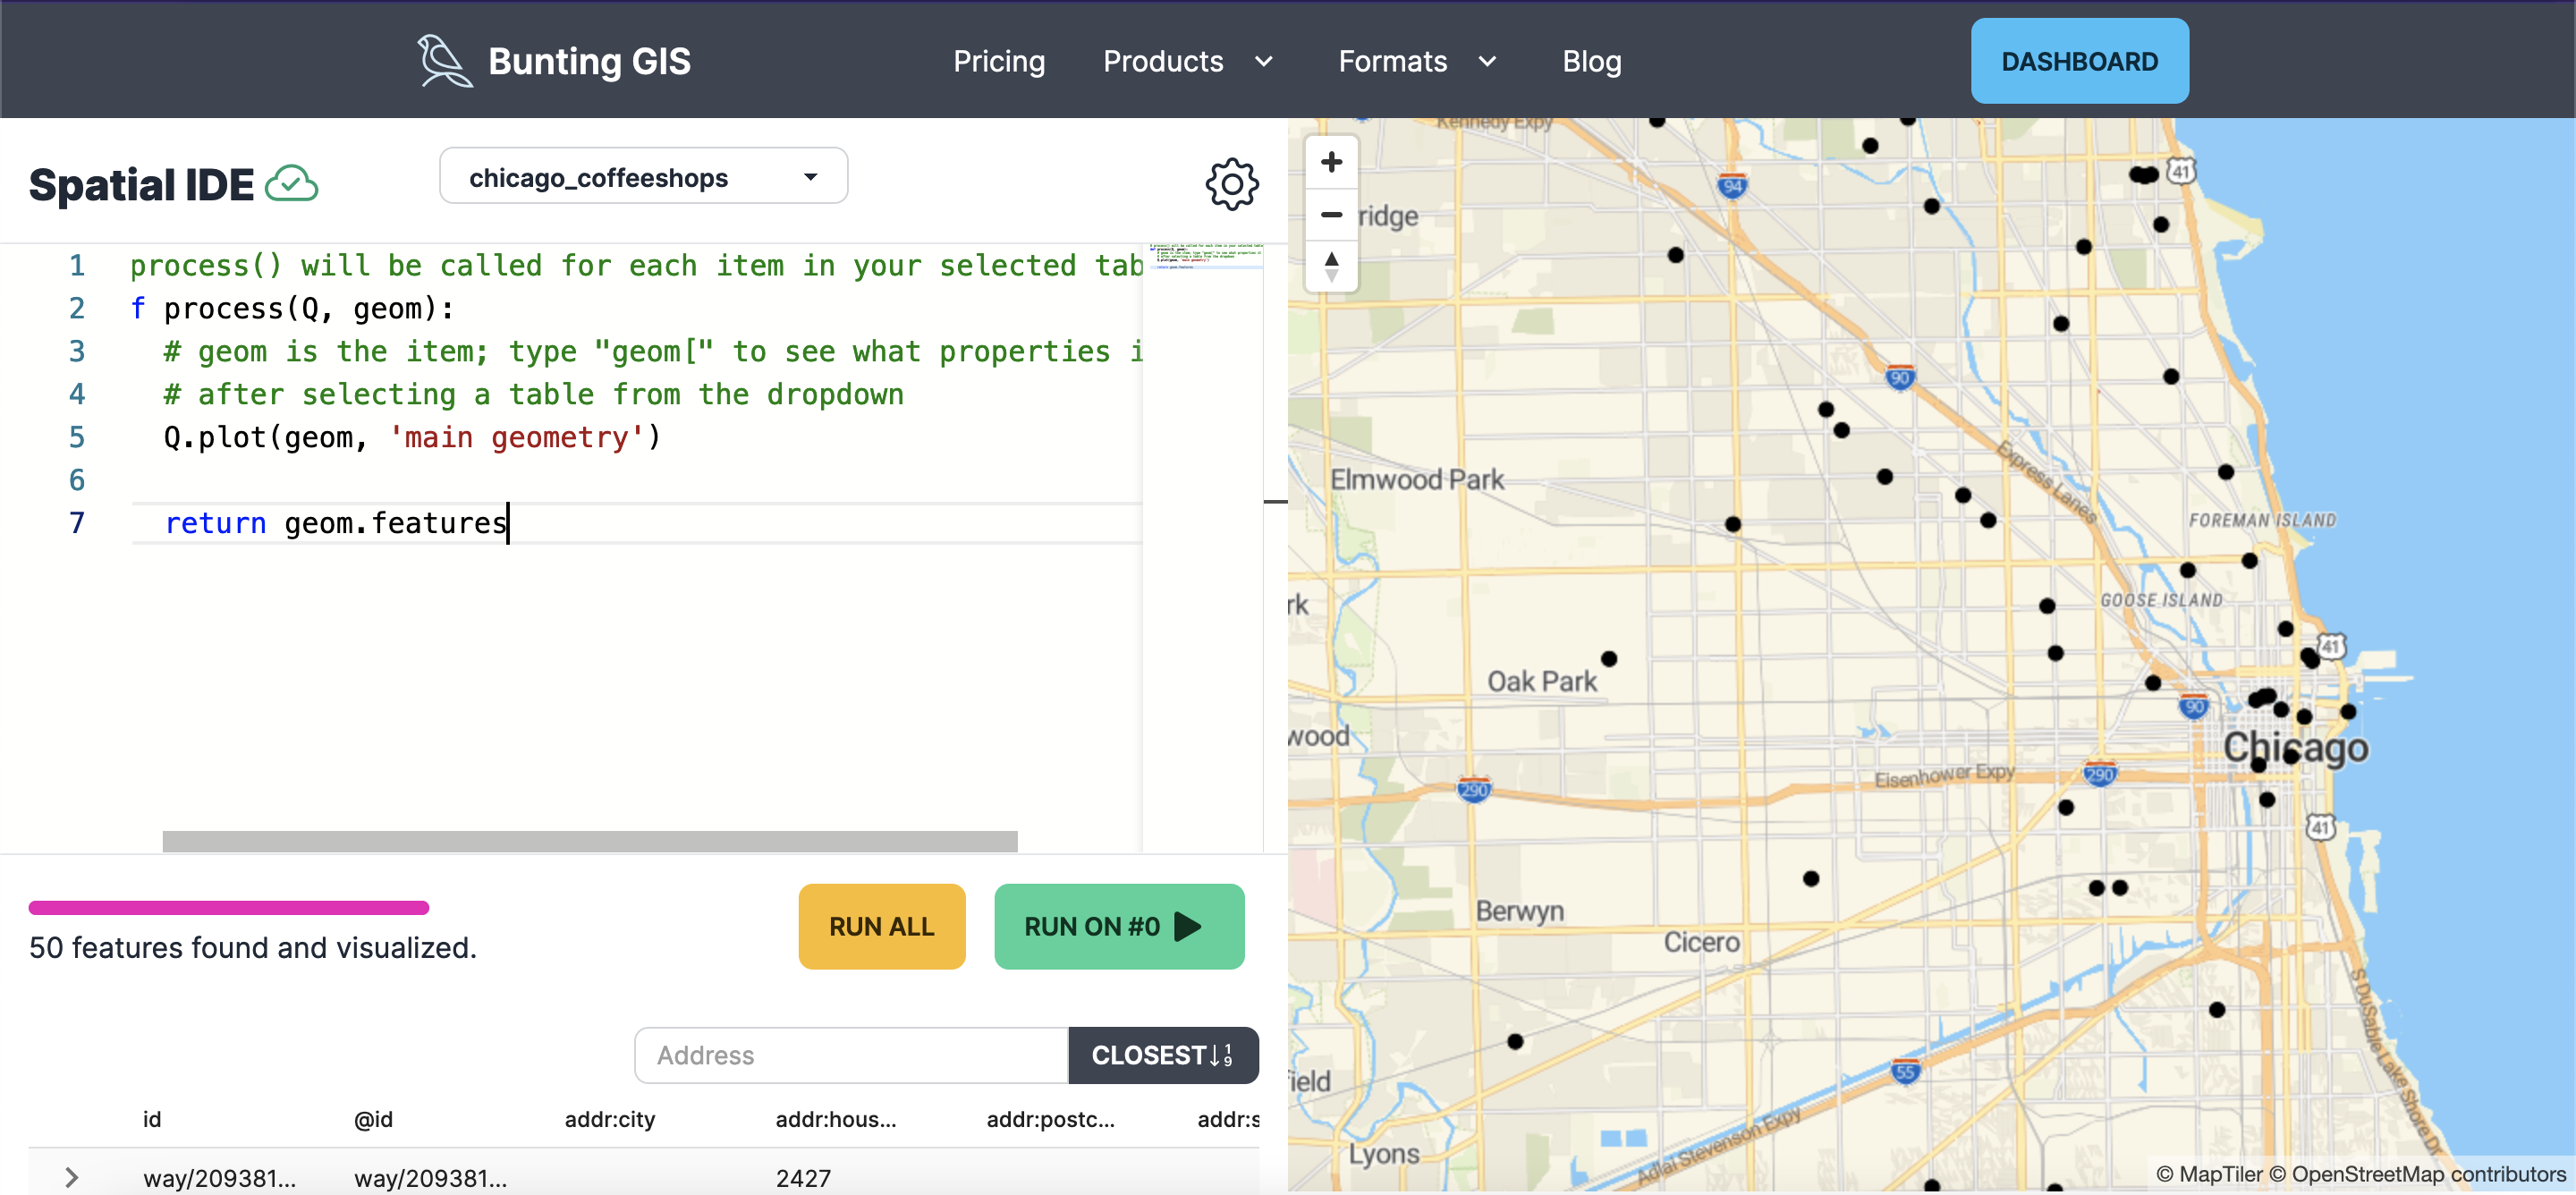
The IDE boots a dedicated Docker instance using Jamsocket for every user, giving them a virtual server to do typically memory-intensive geospatial operations. OpenStreetMap's planet file is 66GB, and we know geospatial companies with RAM in the terabytes for their compute!
With our data uploaded, the IDE projects data to a local coordinate system and
runs a for loop with shapely objects. We've built autocomplete that pulls element
features from uploaded spatial data, supplementary table names, and shapely operations.

Once we hit Run All, the lambda function will run for every element in the dataset, and plot the results on the right.
Elements are also shown in a table, complete with their features (returned as a dict from the lambda) and location. This means you can sort by arbitrary, computed features (area, IRR, proximity to feature). You can also search for an address and find the element closest to the location, convenient for debugging geometric scripts.
The engine that runs it all, mundipy, is now open source as a framework you can host on your own cloud (MIT licensed). Mundipy's documentation is even showcased by mintlify!
The spatial IDE is now in a public beta and we can't wait to see what you can build with it! Tweet us at @BuntingLabs if you have an interesting use case or shoot us an email (in the footer).
You can sign up for the IDE here.