
OpenStreetMap is a huge database of labelled spatial data, making it an excellent data source for geospatial data science in geopandas.
In this tutorial we'll show you how to quickly download excerpts from the database
for a particular kind of feature, like named restaurants (amenity=restaurant&name=*) or
hiking trails (route=hiking). You'll need Python 3 and geopandas installed, along with a free API
key which you can get here.
Choosing a tag (key=value) for your feature
To download a particular type of feature (gas station, highway toll box, bodies of water), you'll need its associated tag. You can find that tag on TagInfo or potentially its associated wiki page. The best way to find that tag is to search Google for "taginfo gas station" and use the tag it provides.
Pulling OSM data into geopandas
We can use an API to download from OpenStreetMap to pull features filtered on the tag above and load it into geopandas.
This is possible because our API returns OGC-compatible geometry types and eliminates
the need to use overpy or Overpass Turbo.
This approach also avoids the throttling or query-took-too-long errors that Overpass API returns.
You can find the API documentation for this endpoint here and can generate a free API key here.
import geopandas as gpd
import urllib.request

bbox = '-118.526344,33.969559,-118.375969,34.072284'
tags = 'highway=primary'
# Get a key here: https://buntinglabs.com/account/register
api_key = 'YOUR_API_KEY_HERE'

url = f"https://osm.buntinglabs.com/v1/osm/extract?bbox={bbox}&tags={tags}&api_key={api_key}"

with urllib.request.urlopen(url) as response:
    osm_data = response.read().decode()

df = gpd.read_file(osm_data, driver='GeoJSON')

print(df.head(3))
#   abutters addr:postcode  ... turn:lanes:forward                              geometry
# 0   retail         90025  ...               None  MULTILINESTRING ((-118.47596 34.0...
# 1   retail         90025  ...               None  MULTILINESTRING ((-118.47748 34.0...
# 2   retail         90025  ...               None  MULTILINESTRING ((-118.47563 34.0...
Passing a bounding box is optional, but lets you only extract the data you need. You can build a bounding box manually at bboxfinder.
Using only certain tags as columns
We can filter for specific tags we want to do work with by using standard GeoDataFrame
column filtering:
df[['name', 'lanes', 'shoulder', 'maxspeed', 'geometry']]
#                             name lanes shoulder maxspeed                      geometry
# 0             Wilshire Boulevard     3      NaN   30 mph  MULTILINESTRING ((-118.47...
# 1             Wilshire Boulevard     2      NaN   30 mph  MULTILINESTRING ((-118.47...
# 2             Wilshire Boulevard     2      NaN   30 mph  MULTILINESTRING ((-118.47...
# 3             Wilshire Boulevard     3      NaN   30 mph  MULTILINESTRING ((-118.47...
# 4             Wilshire Boulevard     2      NaN   30 mph  MULTILINESTRING ((-118.47...
# ...                          ...   ...      ...      ...                           ...
# 1782  North La Cienega Boulevard     6      NaN   35 mph  MULTILINESTRING ((-118.37...
# 1783  North La Cienega Boulevard     7      NaN   35 mph  MULTILINESTRING ((-118.37...
# 1784  North La Cienega Boulevard     7      NaN   35 mph  MULTILINESTRING ((-118.37...
# 1785  North La Cienega Boulevard     7      NaN   35 mph  MULTILINESTRING ((-118.37...
# 1786       San Vicente Boulevard     4      NaN      NaN  MULTILINESTRING ((-118.37...
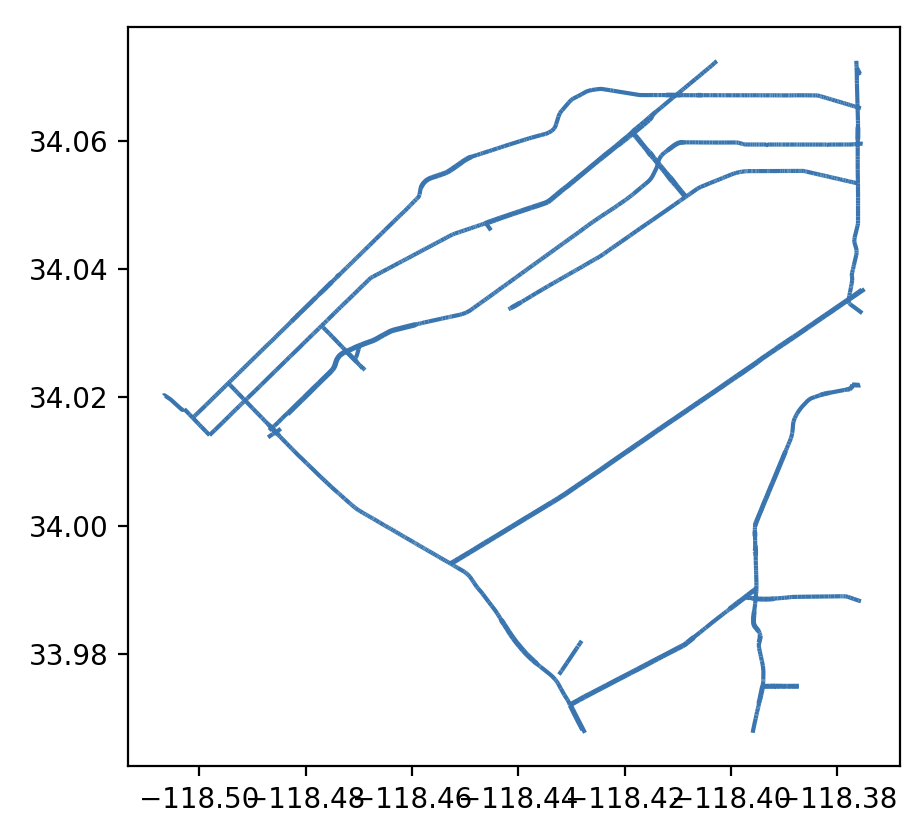
Plotting with geopandas
We can use the built-in functions in geopandas to plot and visualize
the data we just downloaded from OpenStreetMap:
import matplotlib.pyplot as plt

df.plot()
plt.show()
You can also create charts from your geospatial data online without coding using Mundi's chart generator, which lets you upload shapefiles and automatically generate charts from field attributes. See the documentation for more details on plotting and charting from shapefile fields.