
When it comes to maps of the world's real estate, there's three main categories: land use metadata, architectural plans, and professionally surveyed plot outlines.
We'll mainly look at the last category, survey plats. Digitizing the world's plats is one of the last gaps in geospatial data. It's the last gap because it's very difficult to digitize survey plats.
Three types of geospatial maps
Land use metadata, also called POI data, is often stored in massive, structured databases like OpenStreetMap. Databases like OpenStreetMap can be queried through APIs to extract restaurants, hospitals, and roads according to their geographic location. Architectural plans, often stored in as-builts, encode building outlines and the internal construction of buildings. These are usually drawn up by architects.
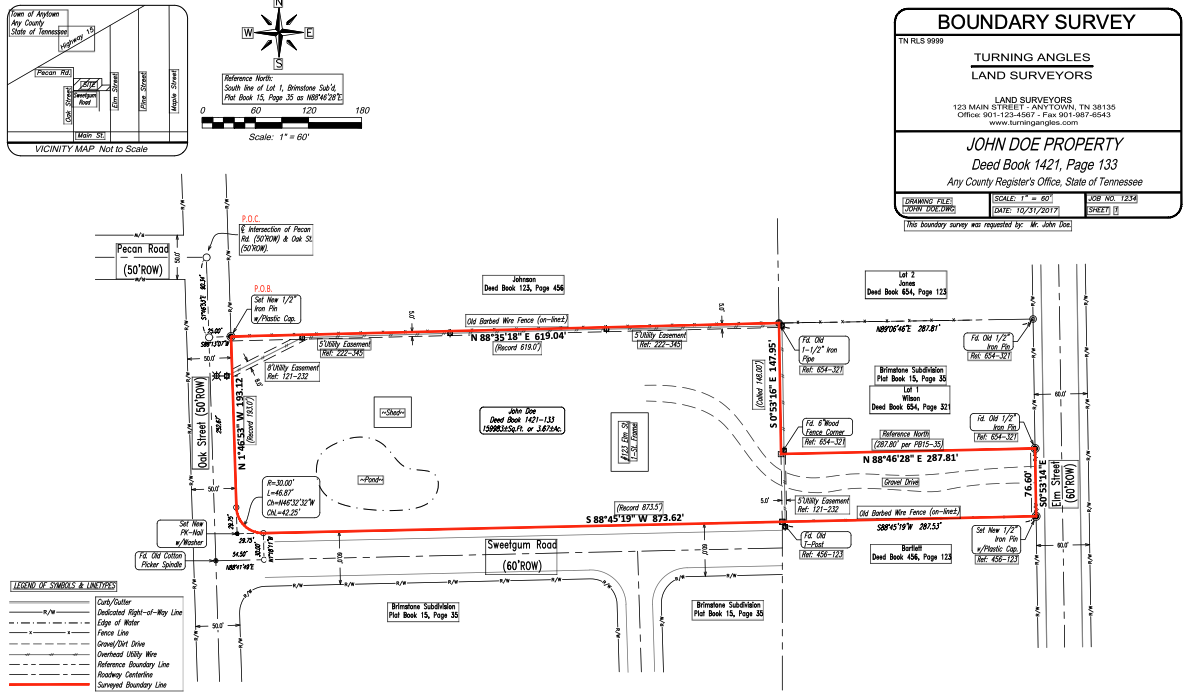
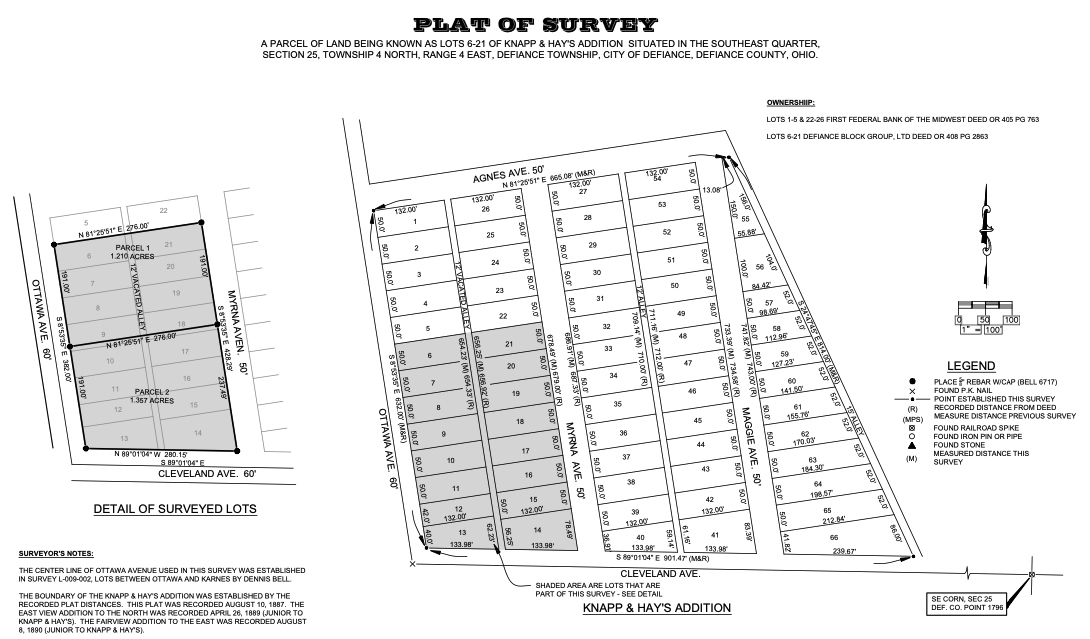
Survey plats outline plots of real estate and detail the legal boundary of a claim. Surveyors use extremely detailed and accurate maps to keep boundaries static and highly accurate over generations.
Survey plats are inaccessible to citizens
Most plats are either digitally stored as PDFs or physically kept in the offices of the municipal assessor. There's a new movement to digitize these PDFs in formats that are usable in GIS systems. When these plats are digitally accessible, mobile apps could allow any citizen to immediately know who owns the land they're on, reducing the number of trespassing violations. Congress recently passed the Modernizing Access to Our Public Land Act, a monumental step forward in digitizing the 50,000+ physical records between the Department of the Interior, the Forest Service, and the U.S. Army Corp of Engineers.
While some of these physical survey plats have been scanned and are available online at the Bureau of Land Management's General Land Office Records website, most of them remain in filing cabinets on government land.
Surveyor's plats are difficult to digitize
When digitizing plats one by one, GIS analysts normally vectorize them by hand in an application like QGIS. We wrote an article on how you can use QGIS to vectorize a zoning map. Plats are far more difficult than a traditional zoning map for a few reasons.
1. Boundary outlines are given as "metes and bounds"
All geospatial data in vector format is given as a list of coordinates comprising a polygon. This convention lets any coordinate stand alone as a meaningful point on earth. Unfortunately, plats follow a different convention.
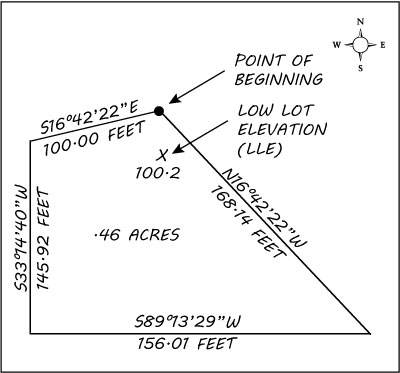
Boundary outlines in plats are formatted as "metes and bounds." Starting at the point of beginning, a surveyor will travel a given distance at a given compass angle, and mark another corner. This will continue until the directions order a return to the point of beginning, closing the polygon. These directions read like:
BEGINNING at the northeast lot corner; thence S16°42’22”E, 100.00 feet; thence S33°14’40”W, 145.92 feet; thence S89°13’29”W, 156.01 feet; thence N16°42’22”W, 223.14 feet; thence 210.49 feet along a curve to the left having a radius of 542.00 feet to the POINT OF BEGINNING
For a computer, this is significantly less readable, and even more difficult when handwritten.
2. Older plats are hand-drawn
The techniques of land surveying have been around since the beginning of human history. Because the outlines of land are passed through generations, the original survey often is continually referenced over time. Only plats from the last few decades are typically computer-generated. The rest are hand-drawn, hand-written, with a ruler if you're lucky.
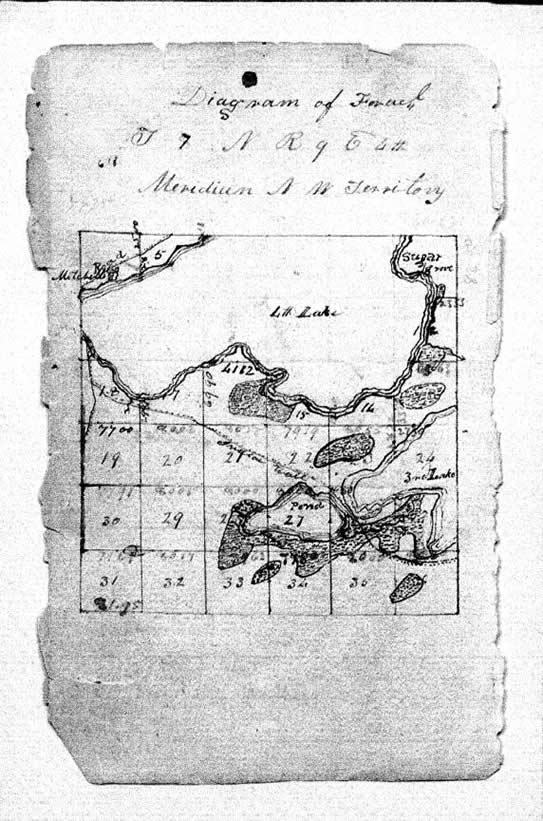
These surveys are significantly less likely to be to scale, making the plat's graphical representation error-prone. Parsing out the metes and bounds is much more important.
3. Cross-referencing other plats is common
Most geospatial coordinates are expressed as pairs of latitude and longitude. For example, (37.757, -122.472) uniquely identifies a point in San Francisco, California.
Instead, plats commonly designate the point of beginning as a point from another specific plat. This requires other plats to be digitized before the one at hand, creating chained dependencies.
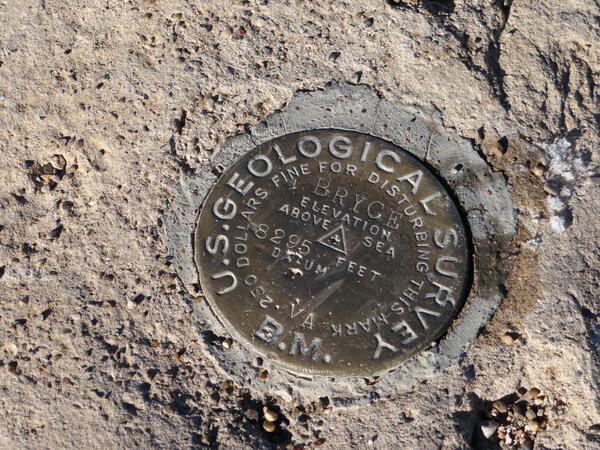
Potentially worse, plats often refer to physical landmarks like rivers, road intersections, or survey markers embedded in rock. If these aren't large enough to be visible in low-resolution satellite imagery, one must either visit the location and georeference the marker to GPS or pay top dollar for high-resolution satellite imagery on demand.
Tools to digitize survey plats
Bunting Labs AI Vectorizer
Since its launch in September of 2024, the AI Vectorizer plugin in QGIS has the ability to automatically extract coordinate geometry from a survey plat PDF.
After drawing the point of beginning, you can upload a PDF — all from inside QGIS — and a large language model will read the metes and bounds from the attached parcel map and return a generated geometry.
To double check for computer reading errors, we check for polygon closure. If the geometry doesn't return to the point of beginning, we'll notify you in QGIS and you won't be charged for the deed.
This survey plat digitizer is the first ever GIS tool to use AI to automatically read survey plats into GIS.
Digitizing one survey plat manually
If you're turning your survey plat into a web map or downloading it into GIS software in a Shapefile, you can use our online tool to digitize surveyors' maps. We'll turn a single PDF into a web map you can share with others for $10.
Another option is to consult a GIS professional and digitize that plat manually. You could use a free and open source GIS software like QGIS that allows you to take a PNG of the plat, import it as a raster image, georeference, then vectorize the plat. The steps are similar to our tutorial on vectorizing a zoning map.
Digitizing thousands of plats automatically
Here at Bunting Labs, we're building software to automatically digitize the thousands of survey plats locked away in PDFs and filing cabinets.
By doing so, we're unlocking the future of geospatial data and allowing new, unseen applications to be built on top of boundary line data.
You can sign up for our AI vectorizer tool to digitize massive projects (over 100 plats). We're happy to consult on large digitization efforts, on a varying range of plat quality.
Converting formatted survey data into GIS
If you have a list of metes and bounds formatted into steps like "S16°42’22”E, 100.00 feet", you might be able to use PlatPlotter to convert a single plat into a usable format, like GeoJSON or a Shapefile.